Progress chart
Progress charts are a graphical representation of progress towards a specific goal or metric.
Usage
This chart displays the progress made toward a certain goal. It allows to monitor objectives, providing critical data for strategic decision-making and more.
Bar chart representation
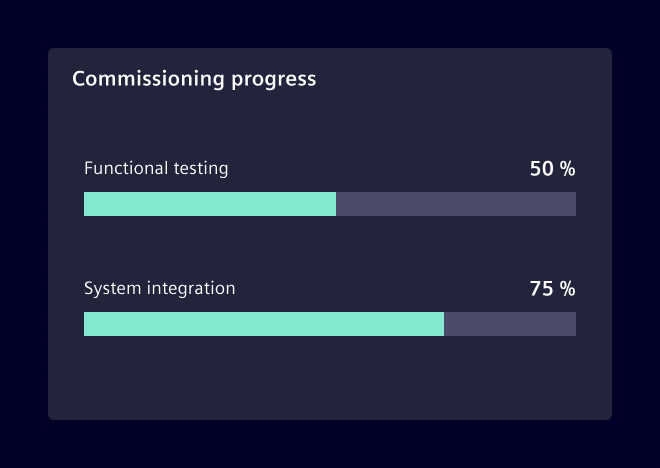
A progress charts chart uses a linear format to represent progress, typically as a bar that grows from left to right. This type of chart works better for layouts that take more horizontal space.
Consider using it when there is a need to display detailed information, such as specific values or long labels, as this information can be displayed alongside the bar.
Radial chart representation
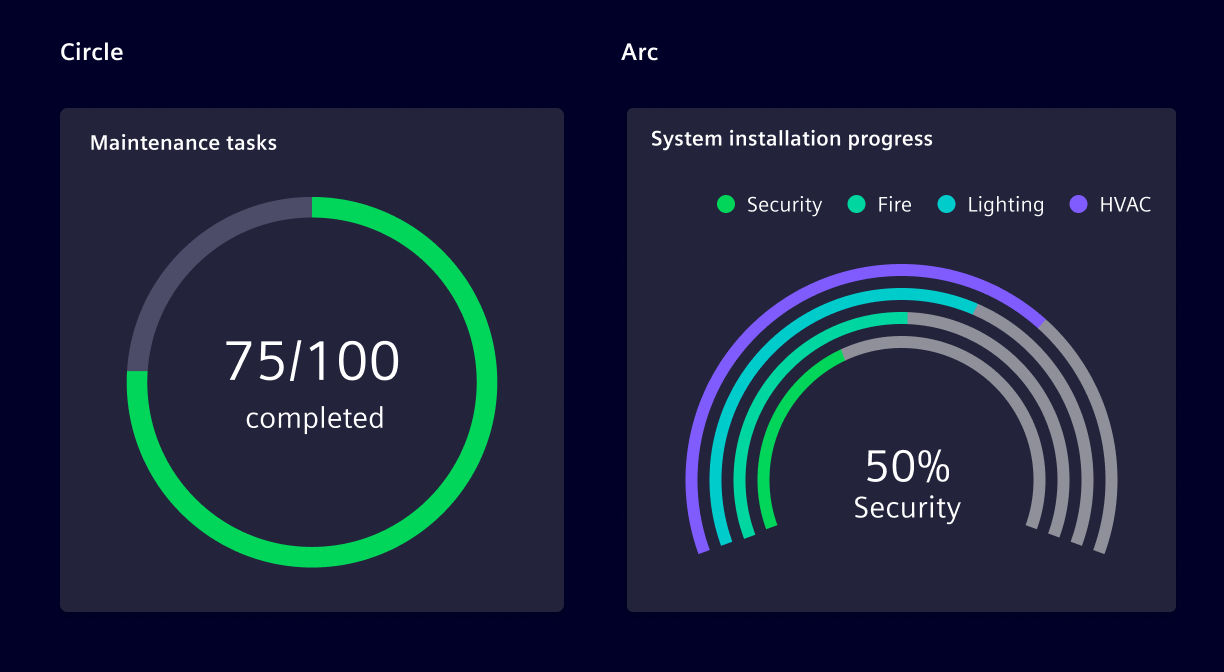
This variation of the chart shows the amount of progress made as a portion of a circle. Use it to display data in a compact and visually appealing way, and to save space on a dashboard or report.
Consider using it to show a general representation of progress, without too many details.
The chart can be configured to be a 360° circle or an arc.
Best practices
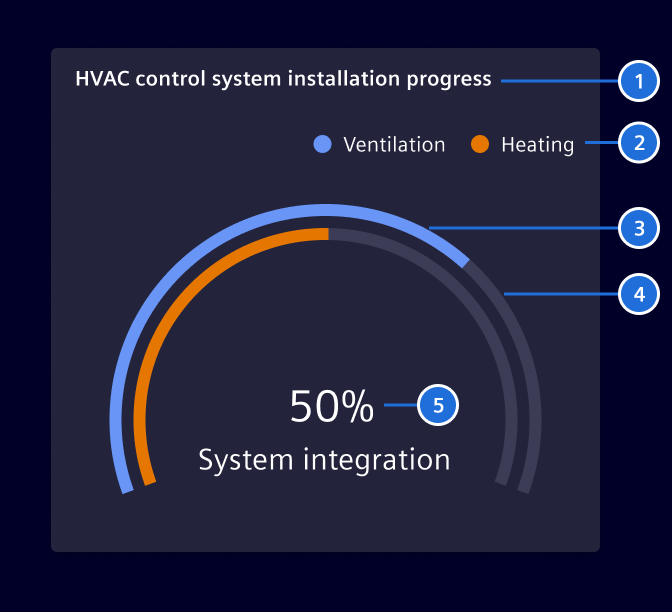
- The default arc angle is
220°. If needed, it can also be configured to360°,90°or270°. - Take the context into consideration when selecting colors. Use colors that are a good match and represent the situation.
- Don't use it if the end of the progress cannot be determined.
- Don't layer more than 4 arcs on the same chart.
- Provide context by including labels or annotations that explain what the chart represents.
Code
Usage
Required Packages
import { SiChartProgressComponent } from '@siemens/charts-ng/progress';

@Component({
  imports: [SiChartProgressComponent, ...]
})
Progress chart
A progress chart displays data values as a simple progress bar shown with arcs instead of bars. Every arc is used to visualize the progression of an item.
SiChartProgressComponent API Documentation
si-chart-progress Input Properties
| Name | Type | Default | Description |
|---|---|---|---|
| additionalOptions ¶ | EChartOption | Used to override specific properties set in options . | |
| autoZoomSeriesIndex ¶ | number | -1 | No auto dataZoom update) by default. Use together with visibleEntries . |
| axisPointer ¶ | (string | boolean | undefined) | false | Used to display axisPointer line either by click or mouse-move. |
| customLegendAction ¶ | boolean | Enable custom legend click actions exposed by the selectionChanged event. | |
| dataAngle ¶ | number | 220 | How big the data can get in degrees. |
| dataZoomFilterMode ¶ | FilterMode | 'none' | The data zoom filter mode. (see https://echarts.apache.org/en/option.html#dataZoom-inside.filterMode ) The value 'filter' will cause the lines to be disconnected to the outside of the chart. |
| dataZoomMaxValueSpan ¶ | number | The upper limit of the data zoom slider (see https://echarts.apache.org/en/option.html#dataZoom-slider.maxValueSpan ). | |
| dataZoomMinValueSpan ¶ | number | The lower limit of the data zoom slider (see https://echarts.apache.org/en/option.html#dataZoom-slider.minValueSpan ). | |
| dataZoomRange ¶ | DataZoomRange | Apply a specific zoom range (see https://echarts.apache.org/en/option.html#dataZoom-inside ). | |
| eChartContainerHeight ¶ | (string | null) | The height of the ECharts container as decimal. | |
| externalXAxisFormatter ¶ | (value: any, visibleRange: number) => string | External XAxis Formatter from consumer | |
| externalZoomSlider ¶ | boolean | false | Flag to use external zoom slider |
| maxEntries ¶ | number | 1000 | Maximum number of series data points shown in the chart. |
| options ¶ | EChartOption | See [ECharts 5.x Documentation] https://echarts.apache.org/en/option.html for all available options. | |
| palette ¶ | string | undefined | The name of the color palette (if any) of the loaded theme . |
| renderer ¶ | ("canvas" | "svg") | 'canvas' | the renderer to use: canvas or svg |
| selectedItem ¶ | SelectedLegendItem | { legendItemName: '' } | Specify selected legend item. |
| series ¶ | ProgressChartSeries[] | The series for the chart. | |
| showCustomLegend ¶ | boolean | false | Enable to show a custom legend. The custom legend offers additional features such as, scroll bar to avoid legend and chart overlapping, Left and right alignment of legends based on y-axis, etc and many more. |
| showLegend ¶ | boolean | true | Show Echarts legend |
| subTitle ¶ | string | The subtitle of the chart. | |
| theme ¶ | any | The desired theme to load. | |
| themeCustomization ¶ | any | Used to override specific options of loaded theme . | |
| title ¶ | string | The title of the chart. | |
| visibleEntries ¶ | number | -1 | No auto dataZoom update) by default. Use together with autoZoomSeriesIndex . |
| visibleRange ¶ | number | -1 | No auto dataZoom update) by default. Use together with autoZoomSeriesIndex . |
| zoomInside ¶ | boolean | false | Enables zooming inside the chart with the mouse wheel/touch. Whether zooming inside the chart is possible with mouse. |
| zoomSlider ¶ | boolean | false | Enables the zoom slider below the chart. |
| zoomSliderBrush ¶ | boolean | true | enable brush mode for zoom slider |
| zoomSliderRealtime ¶ | boolean | true | realtime update mode for zoom slider |
| zoomSliderShadow ¶ | boolean | true | Shows data shadow in dataZoom slider, use together with zoomSlider . |
showTimeRangeBar ¶ | boolean | false | If true, add consumer-provided time range bar. Use together with zoomSlider .Deprecated: The input will be removed in future versions as the time range bar slot is deprecated. |
Output Properties
| Name | Type | Description |
|---|---|---|
| chartGridResized ¶ | GridRectCoordinate | Event emitted when chart grid is resized. |
| chartSeriesClick ¶ | LegendItem | Event emitted when a chart series is clicked. |
| customLegendMultiLineInfoEvent ¶ | CustomLegendMultiLineInfo[] | Event emitted when custom legend multi-line info changes. |
| dataZoom ¶ | DataZoomEvent | Event emitted when data zoom changes. |
| pointer ¶ | AxisPointerEvent | Event emitted when axis pointer moves. |
| selectionChanged ¶ | any | Event emitted when selection changes e.g. clicking on a legend item. |
| showLegendChange ¶ | boolean | Show Echarts legend |
| timeRangeChange ¶ | number | Emitted when data zoom changes, indicating the time range in milliseconds, 0 for full range |
| visibleEntriesChange ¶ | number | No auto dataZoom update) by default. Use together with autoZoomSeriesIndex . |
| visibleRangeChange ¶ | number | No auto dataZoom update) by default. Use together with autoZoomSeriesIndex . |
Attributes and Methods
| Name | Type | Default | Description |
|---|---|---|---|
| startProgressIndication() ¶ | () => void | Show loading indicator. | |
| stopProgressIndication() ¶ | () => void | Hide loading indicator. |
Progress bar chart
A more traditional progress chart using horizontal bars.
SiChartProgressBarComponent API Documentation
si-chart-progress-bar Input Properties
| Name | Type | Default | Description |
|---|---|---|---|
| additionalOptions ¶ | EChartOption | Used to override specific properties set in options . | |
| autoZoomSeriesIndex ¶ | number | -1 | No auto dataZoom update) by default. Use together with visibleEntries . |
| axisPointer ¶ | (string | boolean | undefined) | false | Used to display axisPointer line either by click or mouse-move. |
| customLegendAction ¶ | boolean | Enable custom legend click actions exposed by the selectionChanged event. | |
| dataZoomFilterMode ¶ | FilterMode | 'none' | The data zoom filter mode. (see https://echarts.apache.org/en/option.html#dataZoom-inside.filterMode ) The value 'filter' will cause the lines to be disconnected to the outside of the chart. |
| dataZoomMaxValueSpan ¶ | number | The upper limit of the data zoom slider (see https://echarts.apache.org/en/option.html#dataZoom-slider.maxValueSpan ). | |
| dataZoomMinValueSpan ¶ | number | The lower limit of the data zoom slider (see https://echarts.apache.org/en/option.html#dataZoom-slider.minValueSpan ). | |
| dataZoomRange ¶ | DataZoomRange | Apply a specific zoom range (see https://echarts.apache.org/en/option.html#dataZoom-inside ). | |
| eChartContainerHeight ¶ | (string | null) | The height of the ECharts container as decimal. | |
| externalXAxisFormatter ¶ | (value: any, visibleRange: number) => string | External XAxis Formatter from consumer | |
| externalZoomSlider ¶ | boolean | false | Flag to use external zoom slider |
| labelPosition ¶ | string | Used to display the label in inline or above the progress-bar. | |
| maxEntries ¶ | number | 1000 | Maximum number of series data points shown in the chart. |
| options ¶ | EChartOption | See [ECharts 5.x Documentation] https://echarts.apache.org/en/option.html for all available options. | |
| palette ¶ | string | undefined | The name of the color palette (if any) of the loaded theme . |
| renderer ¶ | ("canvas" | "svg") | 'canvas' | the renderer to use: canvas or svg |
| selectedItem ¶ | SelectedLegendItem | { legendItemName: '' } | Specify selected legend item. |
| series ¶ | ProgressBarChartSeries[] | The series for the chart. | |
| showCustomLegend ¶ | boolean | false | Enable to show a custom legend. The custom legend offers additional features such as, scroll bar to avoid legend and chart overlapping, Left and right alignment of legends based on y-axis, etc and many more. |
| showLegend ¶ | boolean | true | Show Echarts legend |
| subTitle ¶ | string | The subtitle of the chart. | |
| theme ¶ | any | The desired theme to load. | |
| themeCustomization ¶ | any | Used to override specific options of loaded theme . | |
| title ¶ | string | The title of the chart. | |
| visibleEntries ¶ | number | -1 | No auto dataZoom update) by default. Use together with autoZoomSeriesIndex . |
| visibleRange ¶ | number | -1 | No auto dataZoom update) by default. Use together with autoZoomSeriesIndex . |
| zoomInside ¶ | boolean | false | Enables zooming inside the chart with the mouse wheel/touch. Whether zooming inside the chart is possible with mouse. |
| zoomSlider ¶ | boolean | false | Enables the zoom slider below the chart. |
| zoomSliderBrush ¶ | boolean | true | enable brush mode for zoom slider |
| zoomSliderRealtime ¶ | boolean | true | realtime update mode for zoom slider |
| zoomSliderShadow ¶ | boolean | true | Shows data shadow in dataZoom slider, use together with zoomSlider . |
| showTimeRangeBar¶ | boolean | false | If true, add consumer-provided time range bar. Use together with zoomSlider .Deprecated: The input will be removed in future versions as the time range bar slot is deprecated. |
Output Properties
| Name | Type | Description |
|---|---|---|
| chartGridResized ¶ | GridRectCoordinate | Event emitted when chart grid is resized. |
| chartSeriesClick ¶ | LegendItem | Event emitted when a chart series is clicked. |
| customLegendMultiLineInfoEvent ¶ | CustomLegendMultiLineInfo[] | Event emitted when custom legend multi-line info changes. |
| dataZoom ¶ | DataZoomEvent | Event emitted when data zoom changes. |
| pointer ¶ | AxisPointerEvent | Event emitted when axis pointer moves. |
| selectionChanged ¶ | any | Event emitted when selection changes e.g. clicking on a legend item. |
| showLegendChange ¶ | boolean | Show Echarts legend |
| timeRangeChange ¶ | number | Emitted when data zoom changes, indicating the time range in milliseconds, 0 for full range |
| visibleEntriesChange ¶ | number | No auto dataZoom update) by default. Use together with autoZoomSeriesIndex . |
| visibleRangeChange ¶ | number | No auto dataZoom update) by default. Use together with autoZoomSeriesIndex . |
Attributes and Methods
| Name | Type | Default | Description |
|---|---|---|---|
| startProgressIndication() ¶ | () => void | Show loading indicator. | |
| stopProgressIndication() ¶ | () => void | Hide loading indicator. |
Types Documentation
| | |||||
|---|---|---|---|---|---|
| |||||
|
| |
|---|
| | ||||||
|---|---|---|---|---|---|---|
|
| | ||
|---|---|---|
|
| | |||
|---|---|---|---|
|
| | |||||||
|---|---|---|---|---|---|---|---|
|
| | |||||
|---|---|---|---|---|---|
|
| | |||
|---|---|---|---|
|
| | ||||||||
|---|---|---|---|---|---|---|---|---|
|
| | |||
|---|---|---|---|
|
| |
|---|
| | |||||||||||||||||||||||||||||||||||
|---|---|---|---|---|---|---|---|---|---|---|---|---|---|---|---|---|---|---|---|---|---|---|---|---|---|---|---|---|---|---|---|---|---|---|---|
|
| |
|---|
| |
|---|
| |
|---|
| import imported from echarts |
|---|
| import imported from echarts |
|---|
| import imported from echarts |
|---|
| imported from echarts |
|---|
| import imported from echarts |
|---|
| import imported from echarts |
|---|
| import imported from echarts |
|---|
| import imported from echarts |
|---|
| import imported from echarts |
|---|
| |
|---|
| |
|---|
| import imported from echarts |
|---|
| import imported from echarts |
|---|
| import imported from echarts |
|---|
| import imported from echarts |
|---|
| import imported from echarts |
|---|
| import imported from echarts |
|---|
| |
|---|
| |
|---|
| |
|---|
| |
|---|
| |
|---|
| |
|---|
| |
|---|
| |
|---|
| |
|---|
| |
|---|
| import imported from echarts |
|---|
| | |||||||||
|---|---|---|---|---|---|---|---|---|---|
|
| | ||||||||
|---|---|---|---|---|---|---|---|---|
|
| |
|---|
| import imported from echarts |
|---|
| import imported from echarts |
|---|
| import imported from echarts |
|---|
| import imported from echarts |
|---|
| import imported from echarts |
|---|
| import imported from echarts |
|---|
| import imported from echarts |
|---|
| import imported from echarts |
|---|
| import imported from echarts |
|---|
| import imported from echarts |
|---|
| import imported from echarts |
|---|
| import imported from echarts |
|---|
| | ||||||||||||
|---|---|---|---|---|---|---|---|---|---|---|---|---|
|
| | |||||||||||
|---|---|---|---|---|---|---|---|---|---|---|---|
|
| import imported from echarts |
|---|
| import imported from echarts |
|---|
| import imported from echarts |
|---|
| import imported from echarts |
|---|
| import imported from echarts |
|---|
| | |||
|---|---|---|---|
|
Except where otherwise noted, content on this site is licensed under MIT License.