Micro charts
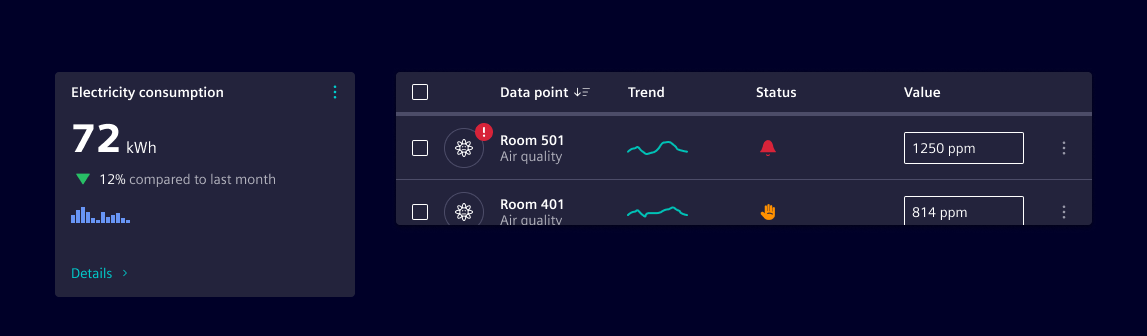
Micro charts are compact, visual elements designed to convey trends, comparisons, and progress at a glance.
Usage
They are ideal for dashboards, tables, and summary views where space is limited but insight is essential.
When to use
- To show data trends or comparisons in a compact space.
- Users benefit from visual context without needing full chart interactivity.
- Summarizing performance metrics, KPIs, or status indicators.
- Common use cases: Table rows with performance data, dashboard widgets, inline summaries in reports or cards.
Best practices
- Micro charts are typically non-interactive and represent a single value or series.
- All micro charts should follow a standard size for uniformity.
- Pair micro charts with clear labels or tooltips for context.
- Use consistent chart types across similar data sets.
- Don’t use micro charts for complex datasets or detailed analysis.
- Don’t rely solely on color to convey meaning—ensure accessibility, use aria labels, alternative text or tooltips.
- Don’t overcrowd the interface with too many micro charts.
Design
They are minimalistic in design and keep visual noise low to maintain clarity.
Types of micro charts
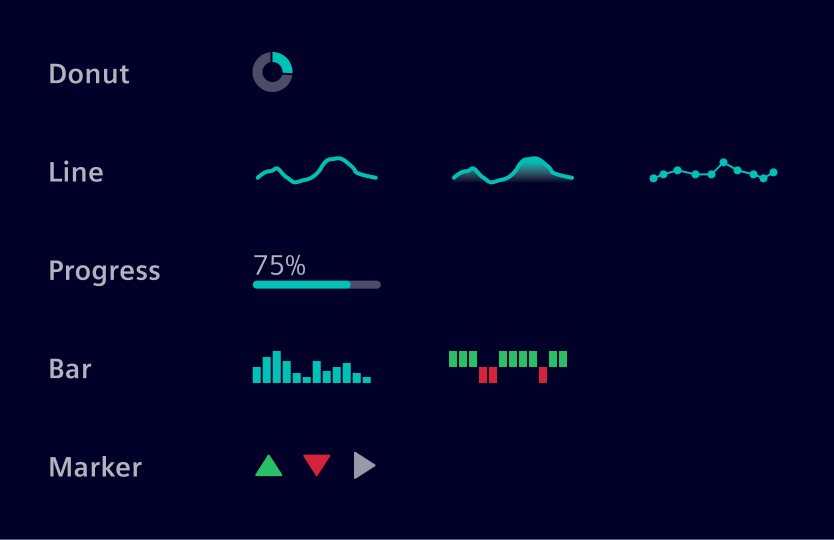
- Donut: Displays proportional data.
- Line: Shows trends over time.
- Progress: Indicates completion or status.
- Bar: Compares discrete values.
- Marker: Green/red up/down marker - Highlights positive or negative change.
Colors
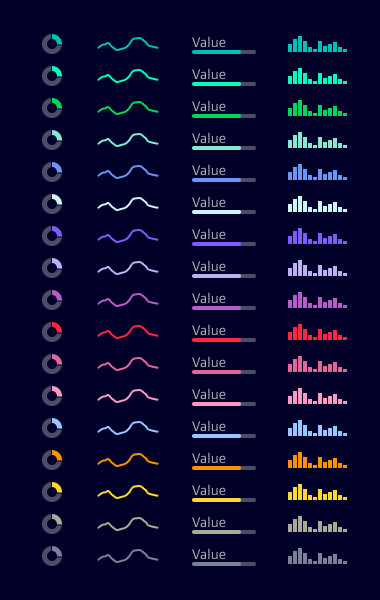
Make use of data visualization categorical colors.
Code
Usage
import { SiMicrochartBarComponent } from '@siemens/native-charts-ng/microchart-bar';
import { SiMicrochartDonutComponent } from '@siemens/native-charts-ng/microchart-donut';
import { SiMicrochartLineComponent } from '@siemens/native-charts-ng/microchart-line';
import { SiMicrochartProgressComponent } from '@siemens/native-charts-ng/microchart-progress';

@Component({
  imports: [SiMicrochartBarComponent, SiMicrochartDonutComponent, SiMicrochartLineComponent, SiMicrochartProgressComponent, ...]
})
Micro charts
SiMicrochartBarComponent API Documentation
selector
si-microchart-bar Input Properties
| Name | Type | Default | Description |
|---|---|---|---|
| height ¶ | number | 24 | Chart height in pixels. |
series ¶ | MicrochartBarSeries | Microchart bar series. Example series can be: Example: Series: MicrochartBarSeries = { values: [2, 4, 5, 3, 5, 7, 7, 9, 11, 10, 12, 9], colorToken: 'si-sys-color-data-categorical-7'}; | |
| width ¶ | number | 64 | Chart width in pixels. |
SiMicrochartDonutComponent API Documentation
selector
si-microchart-donut Input Properties
| Name | Type | Default | Description |
|---|---|---|---|
| radius ¶ | number | 7.5 | Radius of donut. The radius is calculated from center of the donut to the mid point of the arc. |
| series¶ | MicrochartDonutSeries[] | [] | Microchart donut series. Can also be an array representing multiple series. Each series, in case of multiple, forms section of the arc, in percentage of the respective value. Example series can be: Example: Series: MicrochartDonutSeries[] = [{ valuePercent: 40, colorToken: 'si-sys-color-data-categorical-4' }]; |
SiMicrochartLineComponent API Documentation
selector
si-microchart-line Input Properties
| Name | Type | Default | Description |
|---|---|---|---|
| height ¶ | number | 24 | Chart height in pixels. |
| lineWidth ¶ | number | 2 | Line width in pixels. |
| markerColor ¶ | string | Marker color token. If not provided, uses the series color token. Use a data-color. See: https://element.siemens.io/fundamentals/colors/data-visualization-colors/#tokens Example: "si-sys-color-data-categorical-2" | |
| series¶ | MicrochartLineSeries | Microchart line series. Example series can be: Example: Series: MicrochartLineSeries = { values: [2, 3, 6, 5, 4, 7, 8], colorToken: 'si-sys-color-data-categorical-10' }; | |
| showArea ¶ | boolean | false | Sets whether the area under the chart line should be filled. |
| showMarkers ¶ | boolean | false | Display circular markers at each data point on the line. When enabled, markers help highlight individual values and improve readability. |
| width ¶ | number | 64 | Chart width in pixels. |
SiMicrochartProgressComponent API Documentation
selector
si-microchart-progress Input Properties
| Name | Type | Default | Description |
|---|---|---|---|
| barHeight ¶ | number | 4 | Progress bar height in pixels. |
| barWidth ¶ | number | 64 | Progress bar width in pixels. |
| series¶ | MicrochartProgressSeries | Microchart progress series. Example series can be: Example: Series: MicrochartProgressSeries = { valuePercent: 80, colorToken: 'si-sys-color-data-categorical-7' }; |
Types Documentation
| | ||||
|---|---|---|---|---|
|
| One series of the microchart donut. | ||||
|---|---|---|---|---|
|
| | |||
|---|---|---|---|
|
| | |||
|---|---|---|---|
|
Except where otherwise noted, content on this site is licensed under MIT License.