Gauge chart
Gauge charts are data visualization elements that represent one or more values as a position on a radial scale. They display a simple and concise value in comparison to a maximum and minimum limit.
Element provides two gauge components:
- ECharts-based gauge chart (
SiChartGaugeComponent) — a full-featured gauge built on ECharts, part of@siemens/charts-ng. - Native gauge chart (
SiNChartGaugeComponent) — a lightweight, dependency-free gauge, part of@siemens/native-charts-ng.
Usage
Gauge charts are commonly used to display performance metrics, such as percentage completion, quality scores or to indicate real-time values like temperature or speed.
The chart can be accompanied by color coding to indicate different ranges or thresholds. The gauge shows the value and its position between the minimum and maximum, highlighted with a color that corresponds to the range the value currently falls into.
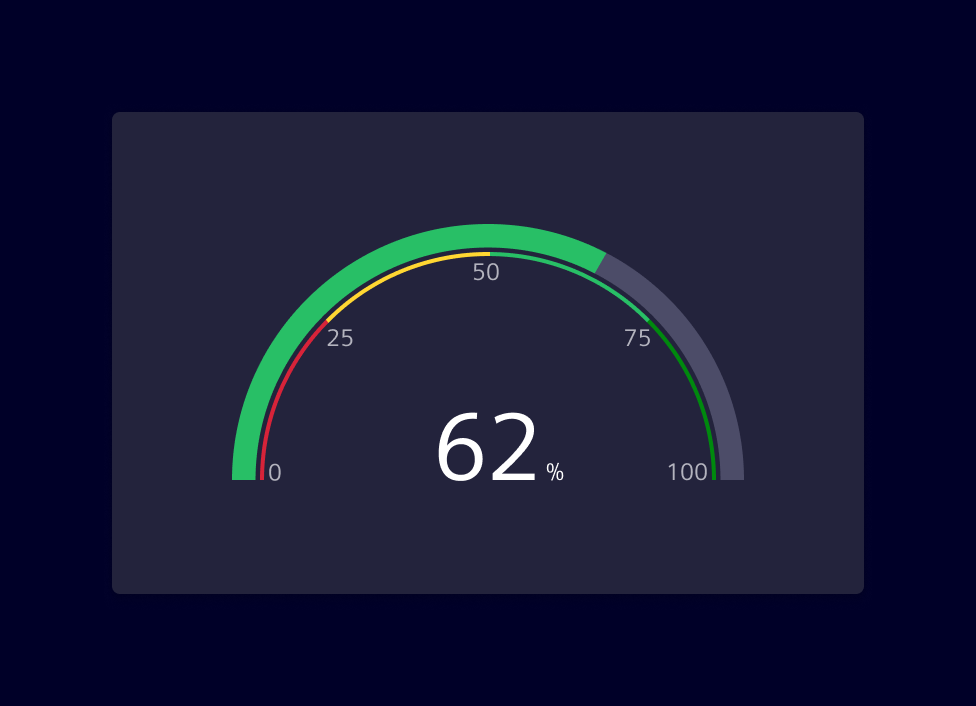
Best practices
- Ensure that the numeric scale used is clear and easy to understand. It's helpful to include the maximum and minimum values, as well as any threshold or target values.
- Color-coding is a useful way to indicate different ranges or thresholds. Choose colors that are meaningful in relation to the data being represented.
- Keep it simple. Gauge charts are best suited for displaying simple, straightforward data.
- If there is a need to represent a crucial system status (e.g:
danger,warningorcaution) provide additional visual cues, such as text labels or icons, to support accessibility.
Choosing a gauge component
Both components cover the same basic use case — showing a value against a minimum/maximum range — but differ in features, dependencies and footprint.
Use the ECharts-based gauge chart when you rely on ECharts-specific configuration options and when the application already uses ECharts for other charts.
Use the Native gauge chart when bundle size or runtime performance is a concern, or when you need to visualize multiple stacked values within a single ring.
Design
ECharts-based gauge chart
A gauge chart displays data similar to a circle chart, but with a needle or dial to indicate where the data point(s) falls over a particular range.
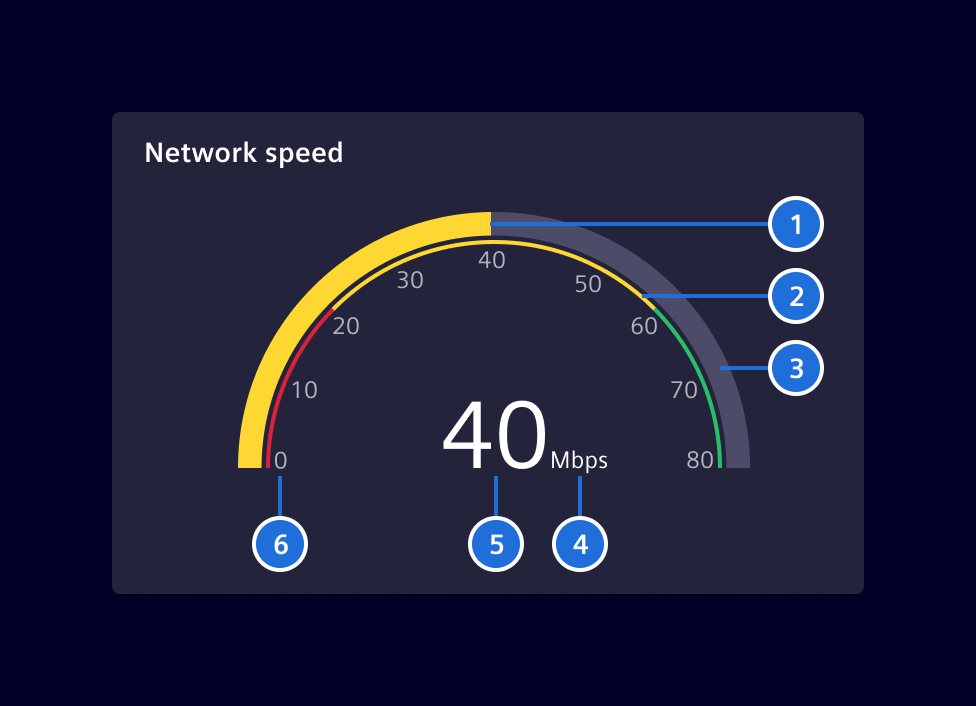
- Progress, 2. Qualitative Range (Optional), 3. Base, 4. Unit, 5. Value, 6. Scale (Optional)
Native gauge chart
T.B.D
Code
ECharts-based gauge chart
Required Packages
import { SiChartGaugeComponent } from '@siemens/charts-ng/gauge';

@Component({
  imports: [SiChartGaugeComponent, ...]
})
SiChartGaugeComponent API Documentation
si-chart-gauge Input Properties
| Name | Type | Default | Description |
|---|---|---|---|
| additionalOptions ¶ | EChartOption | Used to override specific properties set in options . | |
| autoZoomSeriesIndex ¶ | number | -1 | No auto dataZoom update) by default. Use together with visibleEntries . |
| axisNumberOfDecimals ¶ | number | 0 | Number of decimals on the axis. Possible values are from 0 to 100. |
| axisPointer ¶ | (string | boolean | undefined) | false | Used to display axisPointer line either by click or mouse-move. |
| colors ¶ | string[] | Colors for the defined segments. If there are less colors then segments, the colors will be repeated. Defaults to the standard color palette | |
| customLegendAction ¶ | boolean | Enable custom legend click actions exposed by the selectionChanged event. | |
| dataZoomFilterMode ¶ | FilterMode | 'none' | The data zoom filter mode. (see https://echarts.apache.org/en/option.html#dataZoom-inside.filterMode ) The value 'filter' will cause the lines to be disconnected to the outside of the chart. |
| dataZoomMaxValueSpan ¶ | number | The upper limit of the data zoom slider (see https://echarts.apache.org/en/option.html#dataZoom-slider.maxValueSpan ). | |
| dataZoomMinValueSpan ¶ | number | The lower limit of the data zoom slider (see https://echarts.apache.org/en/option.html#dataZoom-slider.minValueSpan ). | |
| dataZoomRange ¶ | DataZoomRange | Apply a specific zoom range (see https://echarts.apache.org/en/option.html#dataZoom-inside ). | |
| eChartContainerHeight ¶ | (string | null) | The height of the ECharts container as decimal. | |
| externalXAxisFormatter ¶ | (value: any, visibleRange: number) => string | External XAxis Formatter from consumer | |
| externalZoomSlider ¶ | boolean | false | Flag to use external zoom slider |
| hideAxisLabels ¶ | boolean | false | Whether to hide the gauge-axis labels. |
| labelFormatter ¶ | (val: number) => string | Custom formatter for axis labels. Takes precedence when specified, i.e. number of decimals, unit etc needs to be set by the user using this formatter. | |
| maxEntries ¶ | number | 1000 | Maximum number of series data points shown in the chart. |
| maxNumberOfDecimals ¶ | number | 0 | Max number of decimals. Possible values are from 0 to 100. |
| maxValue ¶ | number | 100 | The highest value displayed on the gauge axis. |
| minNumberOfDecimals ¶ | number | 0 | Min number of decimals. Possible values are from 0 to 100. |
| minValue ¶ | number | 0 | The lowest value displayed on the gauge axis. |
| options ¶ | EChartOption | See [ECharts 5.x Documentation] https://echarts.apache.org/en/option.html for all available options. | |
| palette ¶ | string | undefined | The name of the color palette (if any) of the loaded theme . |
| renderer ¶ | ("canvas" | "svg") | 'canvas' | the renderer to use: canvas or svg |
| responsiveSplitSteps ¶ | boolean | true | Whether the number of gauge-axis intervals adapts to the component size. |
| segments ¶ | number[] | [0.2, 0.8, 1] | Segments on the arc from 0 (implicit) to 1 (explicit) E.g. 0.2 means from 0 to 0.2 of the possible range (maxValue - minValue) |
| selectedItem ¶ | SelectedLegendItem | { legendItemName: '' } | Specify selected legend item. |
| showCustomLegend ¶ | boolean | false | Enable to show a custom legend. The custom legend offers additional features such as, scroll bar to avoid legend and chart overlapping, Left and right alignment of legends based on y-axis, etc and many more. |
| showLegend ¶ | boolean | true | Show Echarts legend |
| splitSteps ¶ | number | The number of intervals displayed on the gauge axis. | |
| subTitle ¶ | string | The subtitle of the chart. | |
| theme ¶ | any | The desired theme to load. | |
| themeCustomization ¶ | any | Used to override specific options of loaded theme . | |
| title ¶ | string | The title of the chart. | |
| unit ¶ | string | '%' | The unit displayed with the gauge value. |
| unitsOnSplit ¶ | boolean | false | Whether to display the unit on gauge-axis labels. |
| value ¶ | number | 0 | The value displayed by the gauge. |
| valueFormatter ¶ | (val: number) => string | Custom formatter for value. Takes precedence when specified, i.e. number of decimals needs to be set by the user using this formatter. | |
| visibleEntries ¶ | number | -1 | No auto dataZoom update) by default. Use together with autoZoomSeriesIndex . |
| visibleRange ¶ | number | -1 | No auto dataZoom update) by default. Use together with autoZoomSeriesIndex . |
| zoomInside ¶ | boolean | false | Enables zooming inside the chart with the mouse wheel/touch. Whether zooming inside the chart is possible with mouse. |
| zoomSlider ¶ | boolean | false | Enables the zoom slider below the chart. |
| zoomSliderBrush ¶ | boolean | true | enable brush mode for zoom slider |
| zoomSliderRealtime ¶ | boolean | true | realtime update mode for zoom slider |
| zoomSliderShadow ¶ | boolean | true | Shows data shadow in dataZoom slider, use together with zoomSlider . |
showTimeRangeBar ¶ | boolean | false | If true, add consumer-provided time range bar. Use together with zoomSlider .Deprecated: The input will be removed in future versions as the time range bar slot is deprecated. |
Output Properties
| Name | Type | Description |
|---|---|---|
| chartGridResized ¶ | GridRectCoordinate | Event emitted when chart grid is resized. |
| chartSeriesClick ¶ | LegendItem | Event emitted when a chart series is clicked. |
| customLegendMultiLineInfoEvent ¶ | CustomLegendMultiLineInfo[] | Event emitted when custom legend multi-line info changes. |
| dataZoom ¶ | DataZoomEvent | Event emitted when data zoom changes. |
| pointer ¶ | AxisPointerEvent | Event emitted when axis pointer moves. |
| selectionChanged ¶ | any | Event emitted when selection changes e.g. clicking on a legend item. |
| showLegendChange ¶ | boolean | Show Echarts legend |
| timeRangeChange ¶ | number | Emitted when data zoom changes, indicating the time range in milliseconds, 0 for full range |
| visibleEntriesChange ¶ | number | No auto dataZoom update) by default. Use together with autoZoomSeriesIndex . |
| visibleRangeChange ¶ | number | No auto dataZoom update) by default. Use together with autoZoomSeriesIndex . |
Attributes and Methods
| Name | Type | Default | Description |
|---|---|---|---|
| startProgressIndication() ¶ | () => void | Show loading indicator. | |
| stopProgressIndication() ¶ | () => void | Hide loading indicator. |
Native gauge chart
import { SiNChartGaugeComponent } from '@siemens/native-charts-ng/gauge';

@Component({
  imports: [SiNChartGaugeComponent, ...]
})
Sum mode
Multiple series arcs are stacked on the gauge ring. The center shows their combined total.
Single mode
A single arc covers the ring. Colored background segments can be layered beneath the arc to indicate qualitative ranges.
SiNChartGaugeComponent API Documentation
si-nchart-gauge Input Properties
| Name | Type | Default | Description |
|---|---|---|---|
| axisLabelFormatter ¶ | (val: number) => string | Custom formatter for axis labels. Takes precedence when specified, i.e. number of decimals needs to be set by the user using this formatter. | |
| axisNumberOfDecimals ¶ | number | 0 | Number of decimals on the axis. Possible values are from 0 to 100. |
| endAngle ¶ | number | 90 | End angle in degrees |
| legendPosition ¶ | ("row" | "column") | 'row' | Legend position: - column : chart and legend form a column, i.e. the legend is below the chart. The chart size is driven by the available width. - row : chart and legend form a row, i.e. the legend is besides the chart. The The chart size is driven by the available height. |
| markerValue ¶ | number | Optional value displayed as a marker bar across the value arc. | |
| max ¶ | number | 100 | Max value, can be negative |
| maxNumberOfDecimals ¶ | number | 2 | Max number of decimals. Possible values are from 0 to 100. |
| min ¶ | number | -100 | Min value, can be negative |
| minNumberOfDecimals ¶ | number | 0 | Min number of decimals. Possible values are from 0 to 100. |
| mode ¶ | ("sum" | "single") | 'sum' | Display mode: sum to sum up multiple series or single for a single value with optional segmented display. |
| segments ¶ | GaugeSegment[] | [] | Colored segments. |
| series ¶ | GaugeSeries[] | [] | The series for the chart. |
| showLegend ¶ | boolean | true | Whether to show the legend |
| showRangeLabelsOutside ¶ | boolean | false | Whether to show range start/end labels on the outside of the ring |
| showTicks ¶ | boolean | true | Whether to show ticks |
| startAngle ¶ | number | -90 | Start angle in degrees |
| unit ¶ | string | '' | Unit |
| valueFormatter ¶ | (val: number) => string | Custom formatter for value. Takes precedence when specified, i.e. number of decimals needs to be set by the user using this formatter. |
Types Documentation
| | |||||
|---|---|---|---|---|---|
| |||||
|
| |
|---|
| | ||||||
|---|---|---|---|---|---|---|
|
| | ||
|---|---|---|
|
| | |||||||
|---|---|---|---|---|---|---|---|
|
| | |||||
|---|---|---|---|---|---|
|
| | |||
|---|---|---|---|
|
| | ||||||||
|---|---|---|---|---|---|---|---|---|
|
| | |||
|---|---|---|---|
|
| |
|---|
| | |||||||||||||||||||||||||||||||||||
|---|---|---|---|---|---|---|---|---|---|---|---|---|---|---|---|---|---|---|---|---|---|---|---|---|---|---|---|---|---|---|---|---|---|---|---|
|
| |
|---|
| |
|---|
| |
|---|
| import imported from echarts |
|---|
| import imported from echarts |
|---|
| import imported from echarts |
|---|
| imported from echarts |
|---|
| import imported from echarts |
|---|
| import imported from echarts |
|---|
| import imported from echarts |
|---|
| import imported from echarts |
|---|
| import imported from echarts |
|---|
| |
|---|
| |
|---|
| import imported from echarts |
|---|
| import imported from echarts |
|---|
| import imported from echarts |
|---|
| import imported from echarts |
|---|
| import imported from echarts |
|---|
| import imported from echarts |
|---|
| |
|---|
| |
|---|
| |
|---|
| |
|---|
| |
|---|
| |
|---|
| |
|---|
| |
|---|
| |
|---|
| |
|---|
| import imported from echarts |
|---|
| | |||||||||
|---|---|---|---|---|---|---|---|---|---|
|
| | ||||||||
|---|---|---|---|---|---|---|---|---|
|
| |
|---|
| import imported from echarts |
|---|
| import imported from echarts |
|---|
| import imported from echarts |
|---|
| import imported from echarts |
|---|
| import imported from echarts |
|---|
| import imported from echarts |
|---|
| import imported from echarts |
|---|
| import imported from echarts |
|---|
| import imported from echarts |
|---|
| import imported from echarts |
|---|
| import imported from echarts |
|---|
| import imported from echarts |
|---|
| | ||||||||||||
|---|---|---|---|---|---|---|---|---|---|---|---|---|
|
| | |||||||||||
|---|---|---|---|---|---|---|---|---|---|---|---|
|
| import imported from echarts |
|---|
| import imported from echarts |
|---|
| import imported from echarts |
|---|
| import imported from echarts |
|---|
| import imported from echarts |
|---|
| One segment of the gauge chart. The first segment starts at the min value of the gauge chart and ends at endValue . | |||
|---|---|---|---|
|
| One series of the gauge chart. | ||||||
|---|---|---|---|---|---|---|
|
Except where otherwise noted, content on this site is licensed under MIT License.